Experimental Data Refinement Example
Chemical Compounds DEEP PROFILING SERVICES
For Any Chemical Compound comprising C, H, N, O, S, F, Cl, Br, I, Si, P, and/or As.
- Outline
- Basic Analysis
- Statistical Filtering
- Similarity Analysis
Outline
This page summarizes the data refinement process used to determine reliable experimental data points when multiple experimental data points collected for the same property exhibit significant deviations. The normal boiling point has been used as an example. The process includes basic analysis, statistical filtering, and similarity analysis, as outlined below.

Basic analysis conducts a thorough review of the collected data's context and conditions to identify and exclude estimates or inconsistently obtained data. Statistical filtering iteratively removes data deviating significantly from the average, based on set percentage thresholds. Finally, similarity analysis identifies reliable data points by analyzing experimental data of chemically similar compounds within the same functional group or family.
Basic Analysis
For the normal boiling point, we have gathered 182,526 data points for 52,811 chemical compounds from 111,278 distinct sources, such as journal articles, scientific books, patents, and chemical databases. The plot of all these collected data points, arranged by the chemical compound index, is as follows:
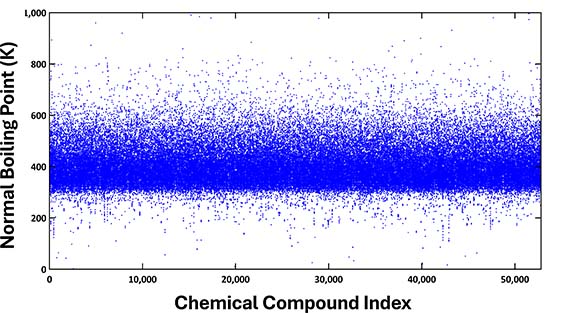
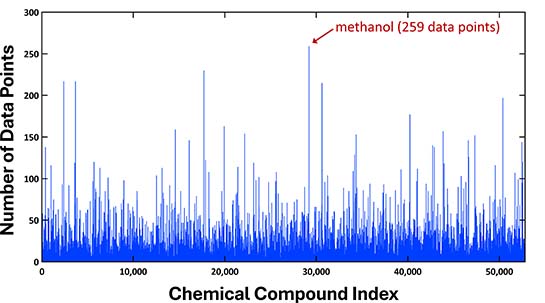
Chemical compounds have been sorted in ascending order based on their boiling point values. The majority of these values were observed to be distributed between 300 and 600 K. Due to the data being sourced from multiple origins, there are instances of multiple boiling points recorded for a single compound. The chart below illustrates the distribution of data points per compound, highlighting that methanol, for example, has up to 259 points.
While the normal boiling point of a compound is a single value, significant deviations were often observed in the collected data. The chart below zooms in on the deviations for normal boiling points from the 5,000th to the 6,000th compound, providing a more detailed view from the earlier plot of all data points. For each compound, the range of values is depicted with horizontal bars, connected by vertical lines that highlight the extent of the deviations.
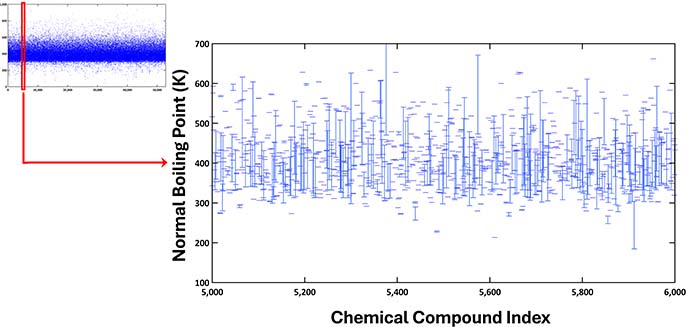
Upon analyzing the normal boiling points of 52,811 compounds, the deviation percentage—calculated as {(max – min)/max} × 100—for each compound ranged from 0.002% to 99.9%. The average deviation across all cases was 16.37%, with a standard deviation of 13.48%. These figures significantly exceed the reported experimental error margin of 2% when measurements are taken by the same researchers in a single, controlled laboratory environment.
Consequently, the origins of the data were meticulously reviewed. Data that were either predicted or estimated, as well as data measured from inconsistent or unclear experimental conditions, were excluded from the list of our reliable datasets.
Statistical Filtering
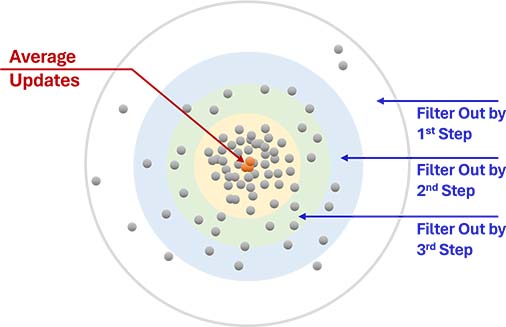
During this stage, after basic analysis, the multiple data points per compound are first averaged. Any data point deviating more than a set percentage (for example, 20-30%) from this average is eliminated. This process is iterative: The remaining data points are averaged again, and any point deviating beyond a progressively lower threshold (e.g., 15-25%) compared to the updated average is removed. This procedure continues until all remaining data points' deviations from the latest average value fall within a sufficiently low range, typically between 5-15%.
This procedure is executed automatically by a custom-developed computer program. The initial deviation percentage criterion (e.g., 20-30%), the reduction in deviation percentage on subsequent steps (e.g., 15-25% on the second step), and the final deviation percentage (e.g., 5-15%) are set either automatically or manually. These criteria are based on factors such as the number of data points per compound, the initial and updated deviation percentages at each step, and the initial and updated average values of the data.
The filtering procedure is not employed when the number of data points per compound is too low. Its primary goal is to statistically eliminate obviously incorrect data, provided that a sufficient number of data points is available for each compound.
Similarity Analysis
This step involves determining reliable data points for each compound through 'similarity analysis,' using data that have passed the statistical filtering stage. For this analysis, normal boiling points of chemically similar compounds within the same functional group or family are plotted to generate a trend curve. The refined data points are then derived based on this trend.
As an example, the chart below shows the similarity analysis for normal alkanes. Here, the boiling points of normal alkanes, post-statistical filtering, are plotted as a function of the number of carbon atoms, starting from methane (1 carbon atom) and extending up to tetratetracontane (44 carbon atoms).
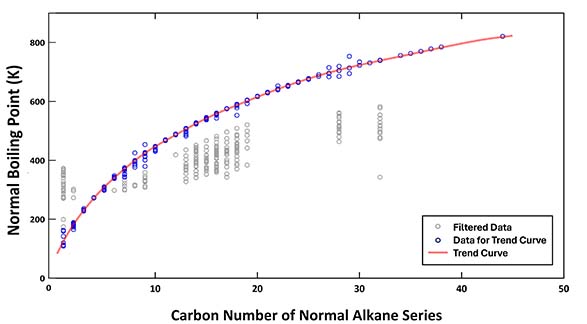
The data points shown in grey were excluded during the filtering process, while the blue points were utilized to generate the trend curve. The refined normal boiling points for each alkane are derived from this curve, assisting in the investigation of the fundamental nature of boiling points.
However, obtaining the trend curve may not be always straightforward. The process varies depending on the type of similar chemical compounds and the available data. It may require iteration with different statistical filtering criteria and multiple attempts at trend curve generation.
This analysis underscores that published data can contain significant errors. It is essential to thoroughly verify whether data are estimated or experimental and to understand the specific experimental conditions. To ensure data reliability, multiple data points for the same compound, along with data from similar compounds, need to be collected, analyzed, and cross-checked.